
Before the Crash: Where the Speculators Were
Hedge funds had a big leveraged long in gold heading into Monday. Friday's report shows whether they got out.
The CFTC data shows who was long gold right before Monday's flush.
On Monday, September 28, gold lost as much as 4% in a single session. Spot gold fell as low as $4,110.55 an ounce, its lowest level since August 5, and U.S. futures settled 3.5% lower at $4,168.40.
Most of the coverage stopped at the headline cause: oil, yields and the dollar. Those matter, and we'll get to them. But there's a second question that almost nobody asked. Who was positioned to get hurt, and did their selling make the move worse?
The data that answers it was public last Friday. Most people just didn't read it.
What Happened Monday
The spark was geopolitical. Oil rose about 3% after President Trump rejected an Iranian peace proposal aimed at resolving the conflict and reopening the Strait of Hormuz.
Higher oil means higher expected inflation. Higher expected inflation means a Fed that stays tighter for longer. The Fed had already raised rates by 25 basis points earlier in September, and by Monday markets were pricing about a 94% chance of another hike in December, according to CME FedWatch. Treasury yields climbed and the dollar sat near a two-month high.
For gold, that's a hard combination. Gold pays no yield, so rising real rates make it more expensive to hold. A strong dollar makes it more expensive for buyers outside the U.S.
That's the fundamental story. It explains which way the price moved. It doesn't fully explain how fast it moved. For that, you need to look at positioning.
The Setup: The September 22 COT Report
Every Friday, the Commodity Futures Trading Commission publishes the Commitments of Traders report. It breaks down who holds futures positions as of the previous Tuesday.
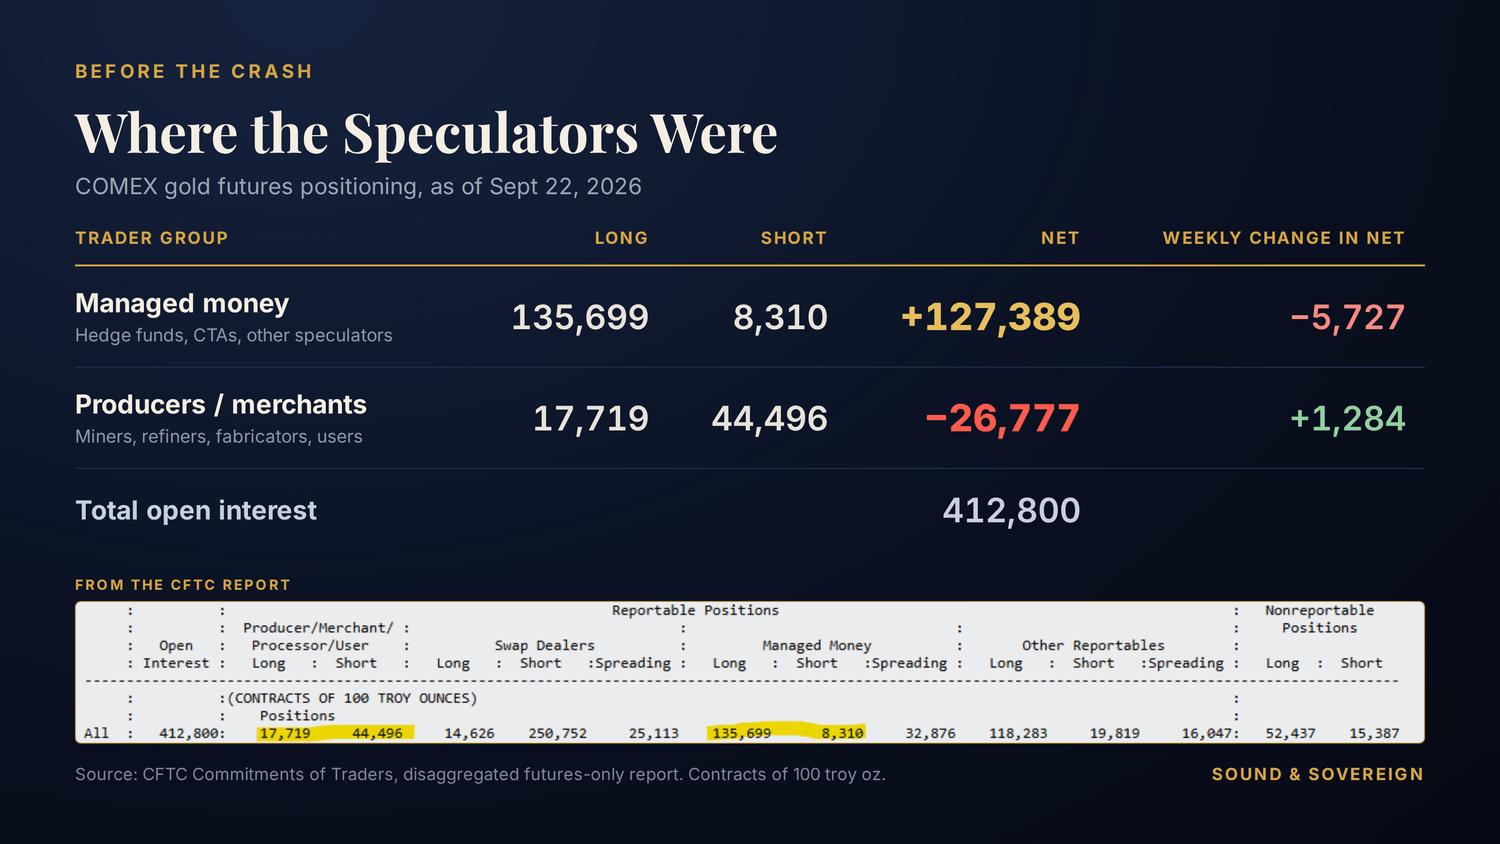
Here's what COMEX gold looked like as of Tuesday, September 22:
Sources: CFTC disaggregated report, CFTC legacy report, FuturesBench.
Look at the two highlighted lines. They show the two sides of the gold market.
On one side are the speculators. Managed money, meaning hedge funds, CTAs and other speculators, held 135,699 long contracts against just 8,310 shorts. That's about 16 longs for every short. Their longs alone made up 32.9% of all open interest, and 92 of these traders were long compared with 14 short.
On the other side are the producers: the miners, refiners, fabricators and other businesses that handle physical gold. They held 44,496 shorts against 17,719 longs, a net short of 26,777 contracts. Their shorts made up 10.8% of open interest.
These two groups aren't playing the same game. A speculator is long because it expects gold to rise. A producer is usually short because it's locking in a selling price for metal it will mine or refine. That's a hedge, not a bet against gold.
Each contract covers 100 ounces. The speculators' net long of 127,389 contracts is about 12.7 million ounces, or roughly $55 billion at about $4,300 an ounce before the drop. The producers' net short is about 2.7 million ounces, or roughly $11.5 billion. Both figures are approximate, but the scale is clear. The speculative long was nearly five times the size of the producers' hedge.
The week's changes show the two sides moving in opposite directions. Speculators cut 6,695 longs, and their net long fell by 5,727 contracts. Producers added 1,323 longs, and their net short shrank by 1,284. The businesses closest to the physical metal were buying a little while the funds sold. But speculators were still heavily long going into Monday.
To be fair, this wasn't a record. Managed-money positioning was around the 68th percentile of the past 52 weeks. That's elevated, not extreme. But it doesn't take a record position to produce a hard flush. It only takes a crowded one and a trigger
How Positioning Moves Price in the Short Run
Here's the mechanism.
Leverage cuts both ways. Futures are traded on margin. A trader only posts a fraction of a contract's value. That multiplies gains when price rises, and it multiplies losses when price falls. A 3% to 4% drop can wipe out a large share of the margin a leveraged long has posted.
Forced selling feeds itself. When losses hit, traders get margin calls or hit their stop-losses. They sell because they have to, not because they've changed their minds about gold. That selling pushes the price lower, which triggers the next group of stops, and then the next.
Crowded trades have narrow exits. When one group holds a large, one-sided position, there are fewer natural buyers below the market. Everyone who wants out is heading for the same door at the same time.
Trend-followers move together. Many managed-money funds are systematic trend-followers, called CTAs. Their models often use the same signals, such as key moving averages and support levels. When price breaks those levels, many of them can flip from buying to selling at once.
Put it together and you get a chain reaction. Oil jumps, yields rise, gold dips, stops and margin calls fire, and forced selling turns a dip into a flush.
The key point is that positioning didn't cause Monday's move. The macro news did. Positioning decided how far and how fast the move went once it started. Positioning is fuel, not the spark.
The Commercials Aren't "Betting Against Gold"
Now for the part people get wrong. A net short of 26,777 contracts from producers and merchants can look like the industry betting against its own product. That's usually not what's going on.
Most of that short position is hedging. A miner sells futures to lock in a price for gold it will pull out of the ground months from now. A refiner or dealer holding physical inventory sells futures so a price drop doesn't wipe out the value of its stock. A jeweler or fabricator may buy futures to lock in the cost of metal it needs later. In each case, the futures position offsets a physical position the business already has.
That's why commercials often move the opposite way from speculators. When prices rise, producers tend to hedge more by selling forward. When prices fall, they tend to cover and buy. You could see that in the Sept. 22 report, when producers added 1,323 longs while the funds sold. That doesn't make them market timers. It's what hedging looks like.
The COT report only shows futures positions. It doesn't show a firm's physical inventory, its full book or its intent. There's a long-running debate about who really moves precious-metals prices, but this data alone can't settle it.
The COT tells you who is exposed in futures. It doesn't tell you who is right.
What Friday's Report Will Tell Us
Friday's CFTC report, due October 2 if released on schedule, will show positions as of Tuesday, September 29. That window includes Monday's drop.
Here's what to watch:
A big drop in managed-money longs means the flush forced speculators out. That clears out weak hands and leaves positioning lighter.
A rise in managed-money shorts means momentum traders are adding new bearish bets on top of the move.
Longs that barely moved means speculators are still exposed, and the risk of another flush remains if support breaks.
Also watch open interest. If open interest falls while price falls, that points to liquidation. If it rises while price falls, new shorts are coming in.
Large Call to Action Headline
A leveraged flush doesn't change the long-term case for gold. Debt, deficits and the slow debasement of the dollar are still there on Tuesday morning. What a flush changes is who holds the metal and at what price.
Traders and long-term holders read the same data differently. For a trader, positioning is about risk management: knowing when the market is crowded and fragile. For a long-term holder, a positioning-driven flush can be a chance to accumulate. Either way, it pays to know where the speculators were.
This is educational content, not investment advice.
Get the Full Breakdown
This was the short version. On my Substack, I go deeper every week with the full COT breakdown, the levels I'm watching, the macro calendar, and scenarios for both traders and long-term holders.
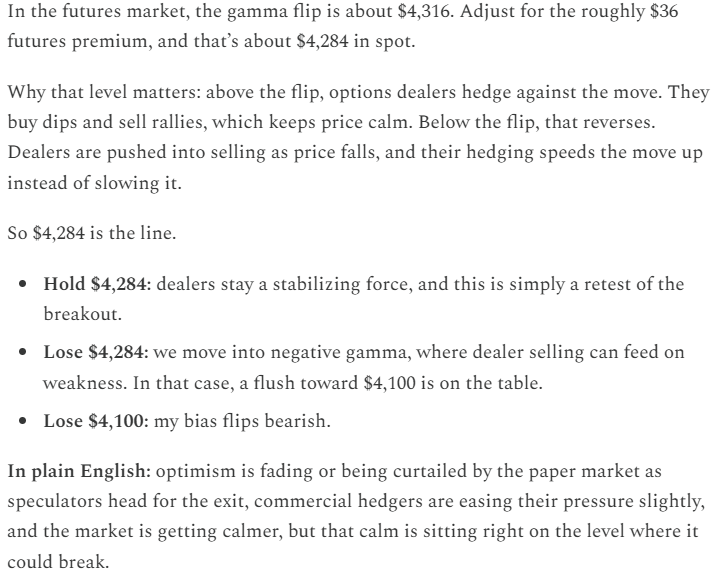
In last week's outlook, I flagged the information below before Monday's drop. You can read exactly what I wrote, and when I wrote it below.
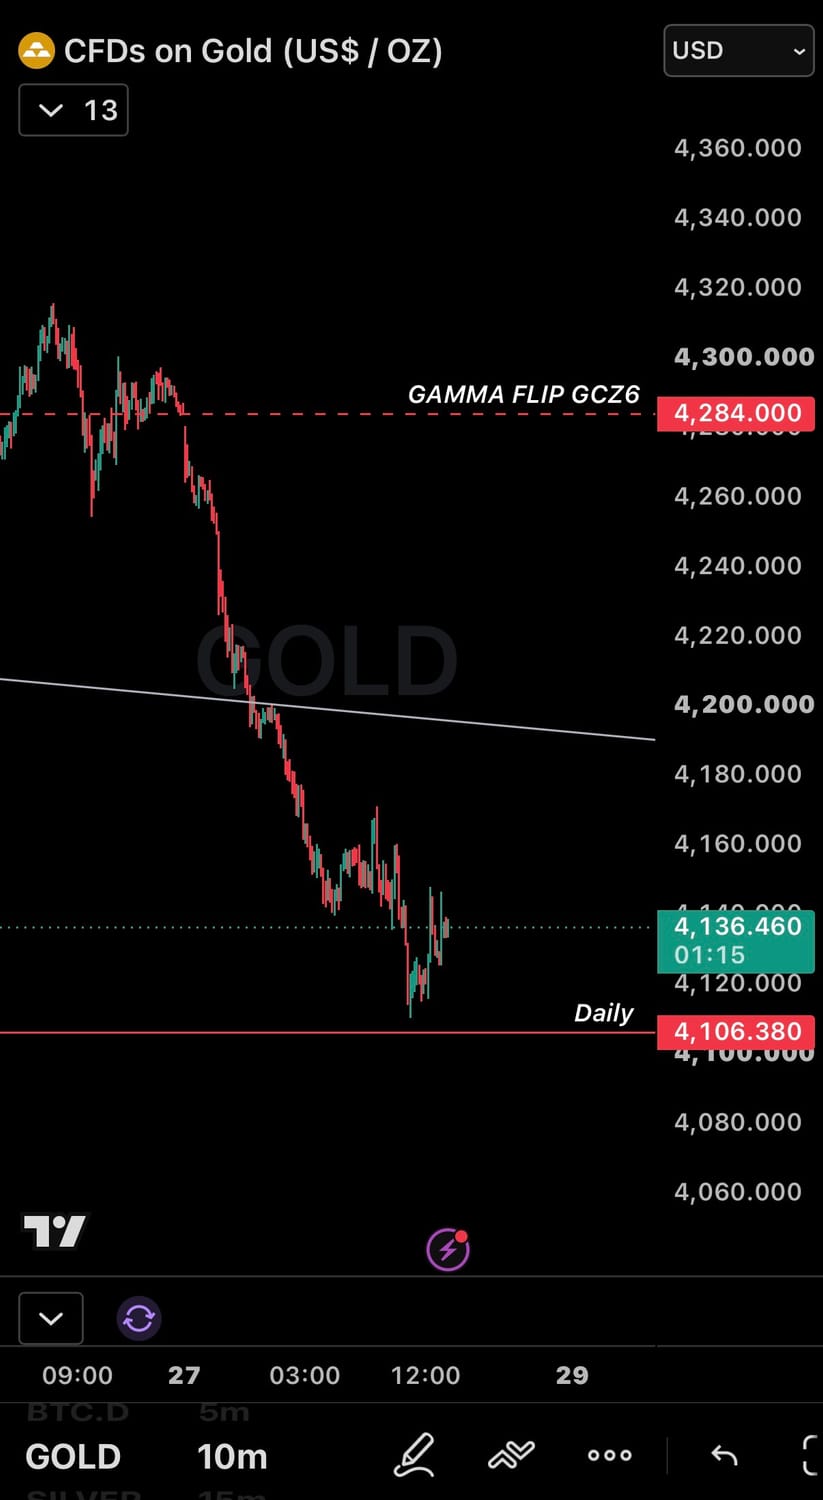
This was the move.
When Friday's report comes out, I'll break down whether the speculators ran, or whether there's more fuel left in the tank. And release my analysis in Sunday's Gold/Silver Outlook.
Understand the System. Protect What You've Built. Preserve Your Sovereignty.
Join thousands of readers exploring money, markets, monetary history and sound money.
ABOUT
FREE MINDS.
FREE MARKETS.
SOUND MONEY.


